My 2027 Gold Price Prediction

I Called $5,337 Gold. It Hit in January. Now Comes My Biggest Prediction Yet.
On December 20, 2025, I made a prediction that probably caused more than a few Wall Street analysts to choke on their morning coffee.
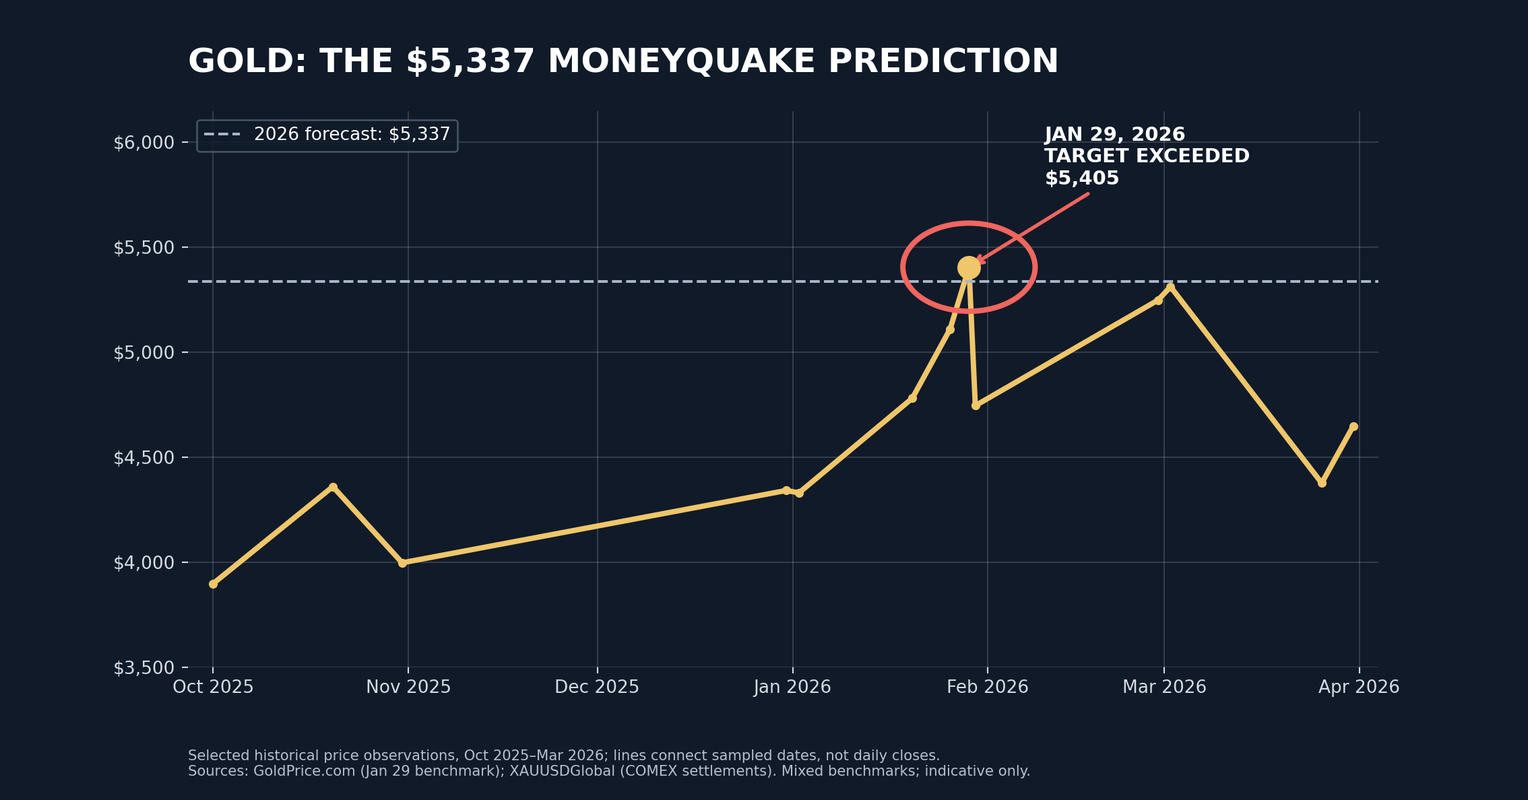
I told readers of Wealth Daily that gold was headed to $5,337 an ounce in 2026.
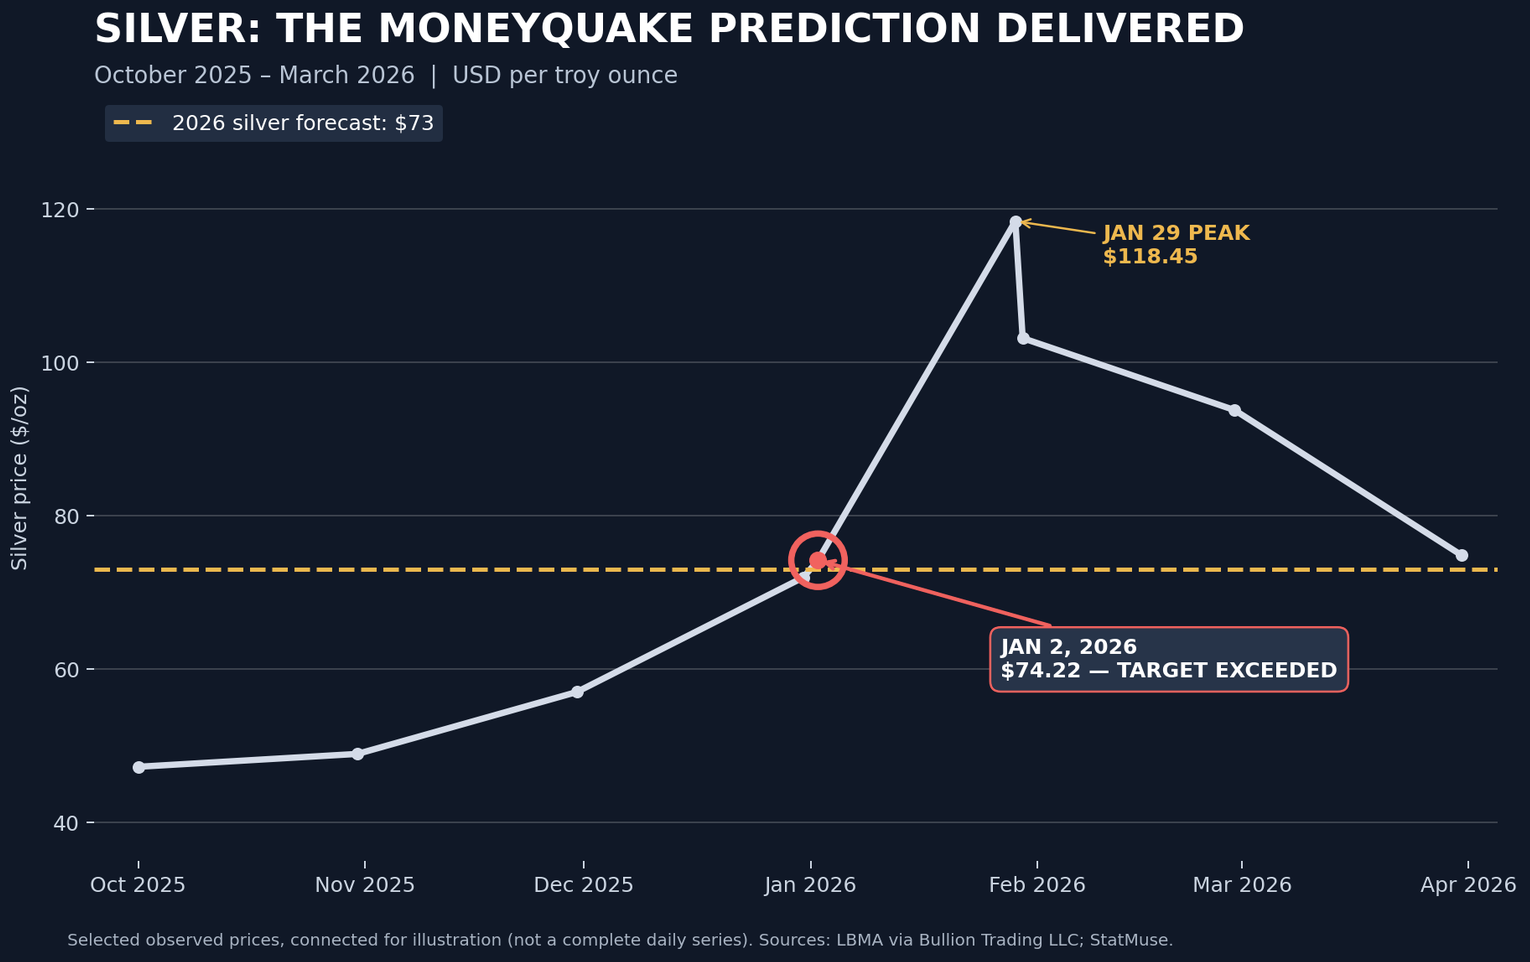
And while I was at it, I predicted silver would reach $73 an ounce.
You can go back and read the original editorial for yourself. It’s still sitting right there in the Wealth Daily archives.
Predictions 2026: The MoneyQuake Ignites — December 20, 2025
I wasn’t hedging my bets.
I wasn’t offering some vague, open-ended prediction about precious metals going higher someday.
I put actual numbers on the table. And I put my name and the reputation of my company behind them.
Then something remarkable happened.
On January 29, 2026 — just 40 days after my editorial was published — gold blew through my $5,337 target.
Silver had already surged beyond my $73 prediction.
Two targets. Two bull’s-eyes.
Before January was even over.
And now, as we prepare to release our highly anticipated MoneyQuake Predictions Podcast for 2027, I’m getting ready to put another set of numbers on the table.

Only this time, the stakes are even higher.
Because what happened in 2026 wasn’t the end of the MoneyQuake.
It was merely the opening act.
The Best Free Investment You’ll Ever Make
Join Gold World today for FREE. Get the latest insight on gold, silver, and precious metals delivered straight to your inbox. When you become a member today, you’ll get our latest free report: “The #1 Golden Token to Buy Now.” Don’t Delay!
After getting your report, you’ll begin receiving the Gold World e-Letter, delivered to your inbox daily.
Gold’s Incredible Run — and the Crash Nobody Saw Coming
To appreciate what happened this year, you have to understand where gold came from.
At the beginning of 2024, gold was trading near $2,063 an ounce.
It was still widely dismissed as a boring, non-yielding relic. But then the monetary tectonic plates began shifting.
Central banks started accumulating gold. The federal debt kept growing. The dollar’s long-term purchasing power continued eroding. And the global financial system began showing signs of a historic realignment.
Gold responded.
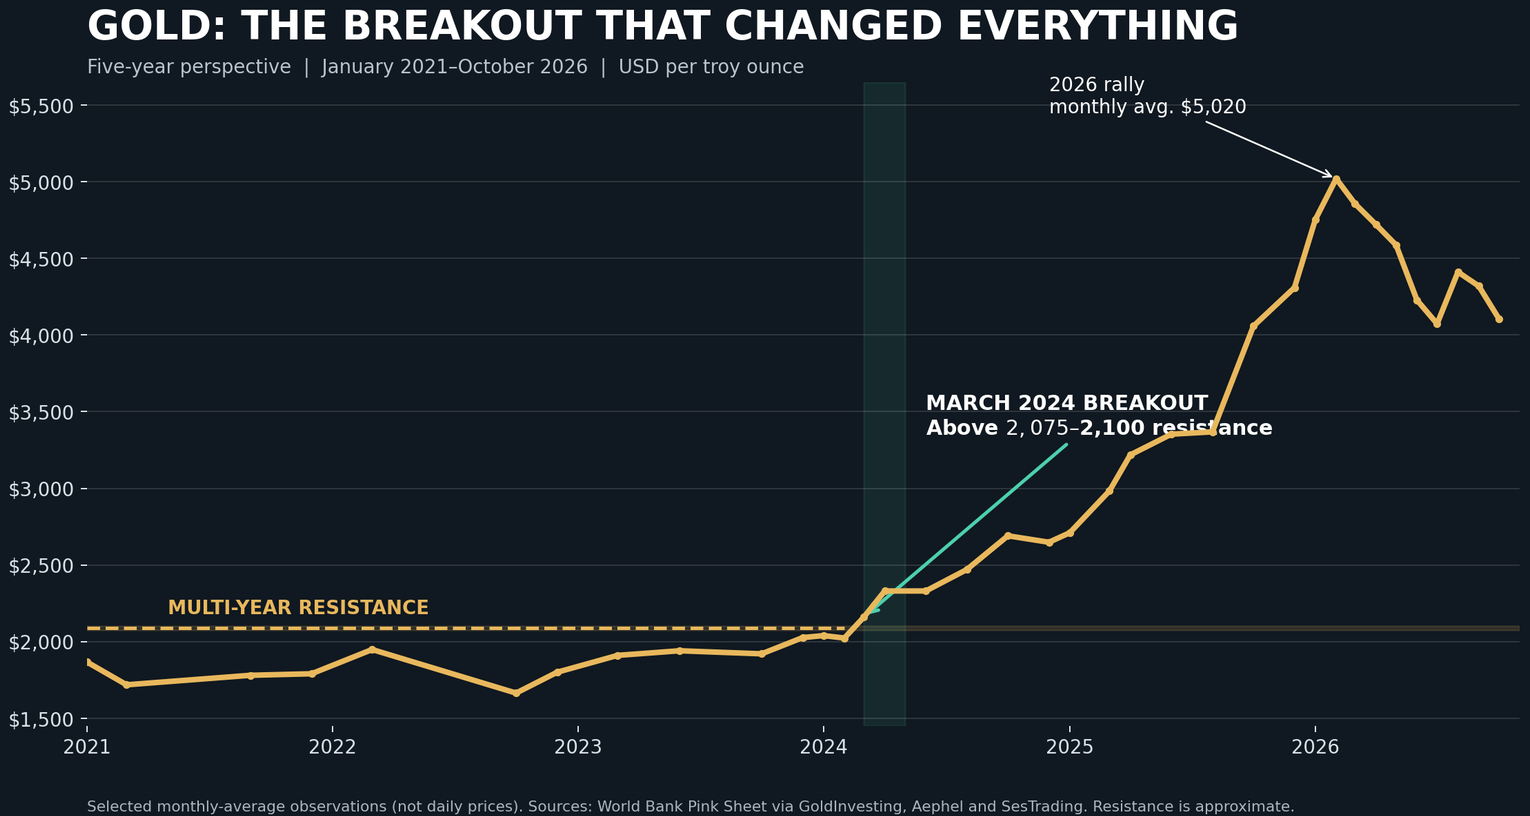
The key technical event was March 2024, when gold decisively broke above the roughly 2,075–2,100 resistance zone that had capped major rallies for several years.
That breakout marked the transition from a prolonged consolidation into a powerful bull market. RBC Wealth Management subsequently identified it as a major breakout from gold’s 2011–2024 trading range.
The above 5-year gold chart highlights three important developments:
2021–2023: Gold repeatedly struggled to sustain a move above approximately $2,100.
March 2024: Gold decisively broke through resistance, beginning a powerful new bullish phase.
2025–2026: Gold accelerated dramatically, with its February 2026 monthly average exceeding $5,000 before the subsequent correction.
Gold’s historic rally didn’t begin in January 2026. It began when a multiyear ceiling finally broke in March 2024. That’s why I use $2,000/oz gold as my base number to predict the price for the next 10 years.
By the time 2026 arrived, the yellow metal had already staged one of the most extraordinary rallies in modern financial history.
Consider the magnitude of the move:
Gold climbed approximately 98% from the beginning of 2024 to its recent price near $4,100.
It rose roughly 55% from the beginning of 2025.
On January 29, 2026, gold reached an intraday record above $5,500, comfortably exceeding my $5,337 prediction.
And then?
The bottom fell out.
Gold suffered a spectacular reversal.
On January 30, bullion plunged nearly 10% in a single trading session — its sharpest one-day decline since 1983.
By early November, gold was trading near $4,100, approximately 25% below its January high and roughly 5%–7% lower for the year, depending on the benchmark and trading date.
To the casual observer, this might look like the end of gold’s bull market.
To me?
It looks like the kind of violent correction that occurs in the middle of a historic monetary transformation.
And there’s a reason. Actually, there are several.
2026: The Year Geopolitics Hijacked the Gold Market
If there’s one lesson investors should take away from 2026, it’s this:
Markets don’t move in straight lines. Especially when Washington and Tehran are involved.
This year delivered two enormous shocks to the global financial system.
The first was the conflict with Iran.
The second was the continuing uncertainty surrounding tariffs and international trade.
Together, they created a financial environment unlike anything we’ve experienced in years.
The Iran conflict sent shock waves through energy markets. Oil prices surged, inflation expectations rose, and investors suddenly faced a problem they hadn’t anticipated.
Gold is supposed to protect investors against inflation and geopolitical uncertainty. But what happens when an inflationary shock also threatens to force the Federal Reserve to keep interest rates higher?
Suddenly, gold finds itself caught between competing forces.
On one side, investors want protection against monetary instability. On the other, higher interest rates and a stronger dollar can make a non-yielding asset like gold less attractive.
That’s precisely the kind of tug-of-war we witnessed in 2026.
Tariffs only complicated matters.
Businesses faced uncertainty over import costs, supply chains, profit margins, and international trade relationships.
Investors struggled to determine whether the next economic shock would be inflationary, recessionary, or some ugly combination of both.
And when investors become frightened enough, they don’t necessarily sell what they dislike.
They sell what they can.
And, dear reader, gold is one of the most liquid assets on Earth. So when financial markets experience stress, gold can become a convenient source of cash.
That’s not necessarily evidence that gold has lost its monetary appeal.
It’s evidence that even the strongest assets can get caught in a liquidity squeeze.
And that’s why I believe the biggest mistake investors could make today is confusing a temporary correction with the end of a secular bull market.
Because beneath all the volatility, something extraordinary is happening.
The Gold Investors Who Didn’t Sell
Here’s a statistic that should make every gold bear uncomfortable.
According to the November 7 edition of Sound Money Report, global physically backed gold exchange-traded funds finished October holding a record 4,275.1 metric tons of gold.
Read that again.
Gold had just suffered a brutal correction.
Its price had declined more than 6% during October alone.
And yet investors collectively held more gold in ETFs at the end of the month than they had at the beginning.
In fact, October marked the fourth consecutive month of global gold ETF inflows.
Approximately $2.66 billion flowed into these funds during the month.
And year-to-date inflows reached approximately $41.2 billion, the third-strongest total on record, according to the World Gold Council figures cited by Sound Money Report.
Central Banks Are Voting With Their Vaults
Here’s another number I want you to remember.
321 metric tons.
That’s approximately how much gold central banks purchased during the third quarter of 2026.
According to the World Gold Council figures highlighted by Sound Money Report, third-quarter purchases were 42% higher than the same period in 2025.
Total central bank purchases reached approximately 675 metric tons during the first nine months of 2026.
That’s 6% ahead of the comparable period last year.
Now ask yourself something.
Why are the world’s central banks buying gold while so many Wall Street commentators are questioning its future?
Because central banks operate on a different time horizon.
They’re thinking about decades. They’re thinking about the future of the U.S. dollar and the international monetary system.
And they’re thinking about what happens when the world’s largest debtor nation continues borrowing money at a pace that its economy cannot indefinitely sustain.
These are precisely the forces I’ve been warning about through my MoneyQuake thesis.
And they’re not disappearing because gold suffered a bad October.
In fact, I’d argue they’re becoming more important.
The Great Wealth Divide
There’s another development that deserves your attention.
And it goes directly to the heart of what the MoneyQuake means for ordinary Americans.
A recent article by Nick Giambruno, published by GoldBroker under the title The Great Wealth Divide: Own the Right Assets or Fall Behind, examined what has happened to American wealth over the past several decades.
The findings were remarkable.
Since 1999, according to the article’s historical comparison:
The U.S. money supply expanded approximately 427%.
Median housing prices increased 156%.
Wages rose approximately 140%.
The S&P 500 gained 523%.
Gold appreciated an astonishing 1,549%.
Let those numbers sink in.
Gold didn’t just outperform wages. It didn’t just outperform housing. It substantially outpaced the expansion of the money supply. And it dramatically outperformed the stock market over that particular period.
Now, I’m not suggesting that gold will outperform stocks every year or that the money supply is a perfect measure of inflation.
But the broader lesson is unmistakable.
The financial system increasingly rewards ownership of appreciating assets.
And it punishes those who depend exclusively on wages and cash savings.
This is the great wealth divide.
It’s also one of the central pillars of my MoneyQuake thesis.
We’re entering an era in which the distinction between people who own scarce assets and people who don’t could become one of the defining economic stories of the next generation.
I’ve been telling my children, my nieces and nephews… anyone who will listen to me, that gold has to be a significant portion of your portfolio – whether it’s physical, digital or both.
Which brings me to my most controversial prediction of all.
$48,571 Gold: The Prediction I Refuse to Abandon
I want to remind readers of something I’ve said before.
My ultimate long-term target for gold isn’t $5,337.
It isn’t $6,000.
And it isn’t even $10,000.
It’s $48,571 an ounce.
Yes.
Forty-eight thousand, five hundred seventy-one dollars.
That number isn’t a typo.
And I haven’t changed it.
I’ve explained the historical reasoning behind that forecast in my Gold Beyond Belief research, which examines the potential consequences of a monetary revaluation on a scale comparable to the great gold bull market of the 1970s.
During that earlier period, gold rose more than 2,000% as the United States abandoned the dollar’s direct convertibility into gold and the global monetary order underwent a historic transformation.
Today, I see the possibility of another monetary transformation.
But this time, the financial system is carrying vastly more debt.
Central banks are diversifying their reserves. Geopolitical alliances are shifting. And a new generation of digital financial infrastructure is making it possible to represent and transfer ownership claims on real-world assets in ways that were unimaginable during the 1970s.
Now, let me be clear.
I’m not predicting that gold will reach $48,571 next year.
Nor am I suggesting that such an extraordinary outcome is guaranteed.
That’s my long-term bull-case destination.
The road there, if my thesis proves correct, will include corrections, setbacks, monetary policy surprises, and periods when gold appears to have lost its way.
But that’s precisely why I believe investors need to think beyond the next Federal Reserve meeting.
Because the MoneyQuake isn’t about a single trade.
It’s about the long-term repricing of money, commodities, and productive assets.
And I believe we’re still in the early stages.
Wall Street Is Finally Catching Up
Here’s where things get interesting.
J.P. Morgan, one of the most influential financial institutions on the planet, sees gold reaching $6,300 an ounce by the end of 2027.
That’s approximately a 54% increase from gold’s recent trading price near $4,100.
Not bad.
In fact, it’s an extraordinarily bullish forecast coming from one of Wall Street’s largest banks.
J.P. Morgan’s June research also pointed to the same structural forces I’ve been discussing: central bank reserve diversification, persistent fiscal concerns, inflation risks, and geopolitical fragmentation.
But here’s the thing. I think J.P. Morgan is being too conservative.
Remember, back in December 2025, I predicted gold would hit $5,337 in 2026.
It took just 40 days for the market to prove that target achievable.
And now I’m looking at 2027.
I’m looking at the enormous fiscal pressures confronting Washington. I’m looking at central banks continuing to accumulate gold. I’m looking at the accelerating competition for natural resources.
And I’m looking at something else.
A monetary system that may be approaching its most consequential transformation in more than half a century.
That’s why my own 2027 gold prediction is higher than J.P. Morgan’s $6,300 forecast.
How much higher?
Well, you’re going to have to tune in to find out.
And silver?
Let’s just say I haven’t forgotten about the other precious metal.
Silver sits at the intersection of the monetary and industrial sides of the MoneyQuake.
It’s a precious metal.
But it’s also an essential industrial input for electronics, solar power, and a growing range of advanced technologies.
And when monetary demand collides with industrial demand in a market much smaller than gold, the price movements can be explosive.
My official 2027 silver target may surprise you even more than my gold prediction.
The Next MoneyQuake Prediction Is Coming
Think back to December 2025.
I gave you a gold price target of $5,337.
I gave you a silver price target of $73.
And before the first month of 2026 had ended, both metals had reached those levels.
Now we’re approaching another new year. Another set of predictions. And, I believe, another extraordinary chapter in the MoneyQuake.
I’ll reveal my specific price targets for gold and silver.
And I’ll show you why the recent correction hasn’t shaken my conviction that the biggest repricing of real assets in modern history may still lie ahead.
Remember…
My long-term gold target remains $48,571 an ounce.
J.P. Morgan sees $6,300 by the end of 2027.
I see something bigger.
And after what happened to my 2026 predictions, I think I’ve earned the right to ask you to hear me out.
Stay tuned.
Because if you thought the MoneyQuake of 2026 was something…
Wait until you hear what I’m predicting for 2027.
Get to the good, green grass first…
The Prophet of Profit,

Brian Hicks
 Check us out on YouTube!
Brian is a founding member and President of Angel Publishing. He writes about general investment strategies for Wealth Daily and Energy and Capital. Brian is the managing editor and investment director of R.I.C.H Report (Retired Independent Carefree Healthy), New World Assets and Extreme Opportunities. For more on Brian, take a look at his editor’s page.
The Best Free Investment You'll Ever Make
We never spam! View our Privacy Policy
After getting your report, you’ll begin receiving the Wealth Daily e-Letter, delivered to your inbox daily.
Angel Publishing Investor Club Discord - Chat Now
Brian Hicks Premium
Introductory

Advanced


