The Bull Market is Over
Everyone in Investing Land is fixated on the 10-year Treasury bond yield as it approaches the magical 3% mark. Make no mistake; 3% is not going to usher in an Age of Aquarius with mystic crystal revelations. No, 3% is dark magic. It will grind bull market bones for its bread.
Evil has been gathering in Mordor all year, as the 10-year broke out over 2.5% on January 9. Stocks fell into darkness on January 29, when yields spiked from 2.67% to 2.84% in five days.
The stock market has been in shadow, staring into the abyss, ever since. The S&P 500 is testing the long-term bull trendline at the 200-day moving average (MA), which currently sits at 2,607, even though earnings and employment continue to improve, as they have for a decade.
And yesterday, the Dow Industrials opened with a nice 150-point pop higher after some decent earnings reports. Caterpillar continued its string of big earnings beats, giving hope that resource-based emerging economies were being supported by better global growth.
Caterpillar’s forces were quickly overrun. By 12:30 p.m., the Dow was down 300 points as that pesky yield moves above 3%…
The Age of Bonds is Over
What is it about that 3% level that is so terrifying?
The 3% yield thing isn’t news in and of itself (though there does come a point where bonds become competition for stocks and borrowing costs become a drag on earnings).
Is 3% necessarily that point? No. But think about the 10-year yield at 3% as if you were programming a computer trading model. You’ve gotta pick some number as an input for interest rates in your model to nail down a point of no return. Three might seem like a good one…
By itself, 3% doesn’t mean anything. But if all the trading programs have 3% as a significant number, then it’s significant. And what’s more, if you know everybody’s looking at 3% as a tipping point, why would you be the first to change it? You wouldn’t. Especially when you know the Fed is likely to lay down more rate hikes over the next few months.
Now, as it happens, 3% on the 10-year actually does have some meaning, as you can see in this chart from the good people at Kimble Charting Solutions:
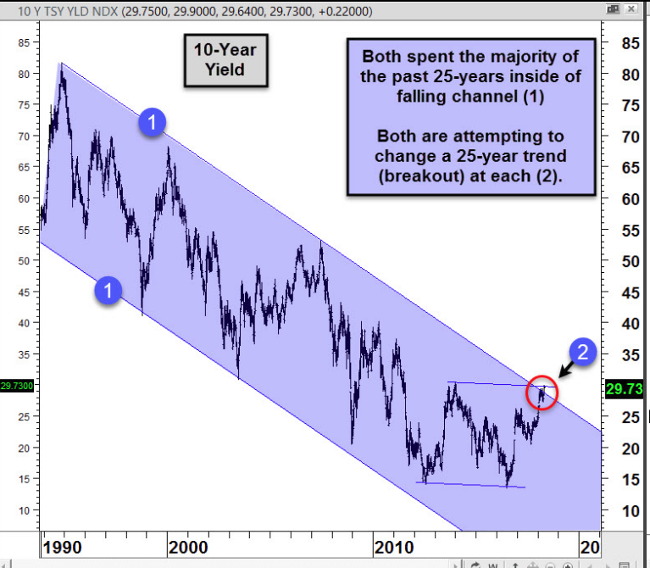
Just as stocks are testing their long-term trendline, bonds are testing theirs. And the bond bull market has been in place a lot longer…
This chart shows you that for 30 years, pretty much any spot where you bought 10-year Treasury notes, you made money. Sure, you could have picked bad times to buy. But overall, the long-term trend has been that yields (the cost of money) have been falling steadily. Which means the price has been rising.
This chart suggests that we could be in for a new trend, one where yields rise steadily… and price falls. In this environment, why do you buy bonds at all, if the price is likely to be lower down the road?
This isn’t just an academic question. The U.S. government has a big budget gap that it fills with bond sales. Corporations rely on the bond market to raise cash all the time.
The end of the bond bull market could have some pretty severe real-world consequences.
Join Wealth Daily today for FREE. We’ll keep you on top of all the hottest investment ideas before they
hit Wall Street. Become a member today, and get our latest free report: “Why You Need to Fire Your Money
Manager.”
It contains full details on why money managers are overpaid and provides you with
tools for growing your wealth.On your own terms. No fees, no comission.
When it Rains, It Pours
The great thing about the stock market is that it’s never just one thing. It’s always a bunch of different themes/catalysts working together to create a trend. For a decade we’ve had rising earnings, low rates, an accommodative Fed, share buybacks, rising employment, dividend hikes, and so on.
The last big run for stocks came on the anticipation that tax cuts would boost earnings further and perhaps even raise wages, dividends, and corporate investment. This process, where investors account for a future event in today’s valuations, is known as “pricing in.” We “price in” the future event. That’s happened — investors have already priced in the corporate tax cuts.
Investors are now wondering how strong earnings are, really, if you back out the tax cuts (don’t miss the fact that companies like 3M and Johnson & Johnson have missed earnings expectations, even with the tax cut wind at their backs).
And if all that’s not enough, there’s now a negative story for tech: regulation (thanks, Facebook) and weakening smartphone sales.
Now, let me show you the S&P 500 chart I shared with my Real Income Trader subscribers yesterday morning:
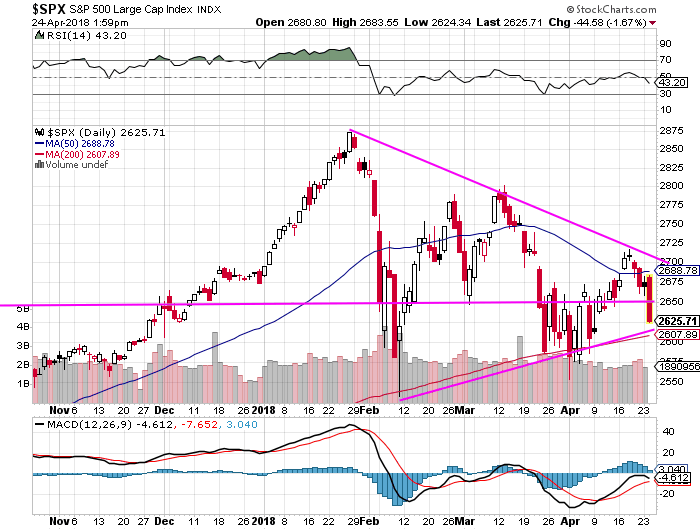
I drew the pink lines on the chart to show the recent trend. The blue line is the 50-day moving average. The red line at the bottom (which is a bit obscured by the pink line) is the long-term trendline of the 200-day MA.
Notice that the S&P 500 hasn’t been able to break above the top trend line. It’s created a series of lower highs. Next, the 50-day MA (blue line) has turned down, indicating that the medium-term trend is reversing.
Now, when I sent this chart yesterday at 10:15 a.m., stocks were still up on the day. That giant red bar on the far right hadn’t formed… yet.
It’s a general rule of chart analysis that the more times a trendline or support/resistance line gets tested, the weaker it becomes. And as you can see, the S&P 500 bounced quickly and strongly the first time it hit the trendline back in February. The second time, it took a whole lot longer to bounce. And the bounce was much weaker. Investors are selling the rallies.
Now, the S&P 500 is on the verge of testing that lower line — the long-term trendline — again. How will it play out this time? I don’t know, but I will tell you I recommended some put options on my favorite bank as yesterday’s drop was getting underway.
The 200-day MA for the S&P 500 sits at 2,607. I will not be surprised to see a move even lower than that over the next couple days. And what then? Is the bull market for stocks really over?
I don’t know. But I’m expecting to take profits on those puts today, because I think some kind of rebound is coming soon. Look for the S&P 500 to break below that 200-day MA, get everybody all fired up that another plunge is coming, and then stage a strong rebound to the upside.
Until next time,

Briton Ryle
 @BritonRyle on Twitter
 The Wealth Advisory on Youtube
 The Wealth Advisory on Facebook
A 21-year veteran of the newsletter business, Briton Ryle is the editor of The Wealth Advisory income stock newsletter, with a focus on top-quality dividend growth stocks and REITs. Briton also manages the Real Income Trader advisory service, where his readers take regular cash payouts using a low-risk covered call option strategy. He is also the managing editor of the Wealth Daily e-letter. To learn more about Briton, click here.
The Best Free Investment You'll Ever Make
We never spam! View our Privacy Policy
After getting your report, you’ll begin receiving the Wealth Daily e-Letter, delivered to your inbox daily.
Angel Publishing Investor Club Discord - Chat Now
Brian Hicks Premium
Introductory
Advanced