The equity markets just can’t seem to sit still. There’s an awful lot of sugar running through their blood. The broader S&P 500 index is up a hyper 26% this year and a frenetic 153% over the last four years, averaging 38% each.
 As the run extends itself further and further, the bulls grow ever more carefree, while the bears grow ever more cautious. Yet each group is failing to see something critically important about the state of the markets today and where they may be headed.
What the bears fail to realize is that the markets’ recent performance is nothing new, with two similar stellar rallies in the recent years before it. They are misreading the markets’ true performance – the markets aren’t really overheating because people are using the wrong starting point.
What the bulls fail to note is that each of the previous stellar rallies was quickly followed by a spectacular plunge of 46% and 55% respectively. They too are misreading the markets’ true performance – the markets aren’t really running on their own power but on Federal Reserve-injected adrenalin.
We really needn’t debate which side is right, because the equity markets are all-encompassing… they have a treat and a trick for everyone. Each side will get theirs in due course, likely over the next two years.
Markets Aren’t Really That Dangerous
The bearish view that the four-year equity bull run is overheating and unsustainable is rather misguided. For the most part, “we’re fairly valued,” Chad Morganlander, portfolio manager at Stifel Nicolaus & Co., assessed to Bloomberg last week.
What makes the bears nervous is the 38% average annual growth rate since the 2008-09 correction. But in truth, the growth rate really isn’t that — for they are using the wrong starting point.
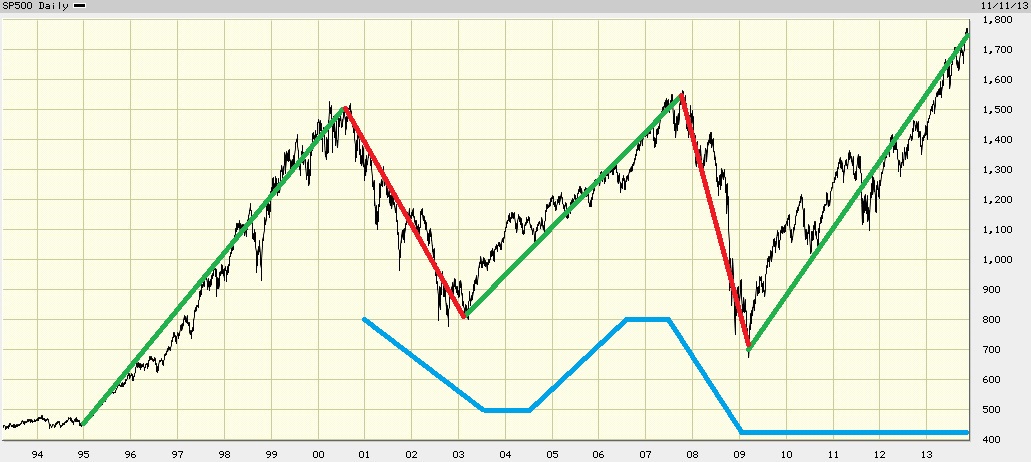
If you consider the latest bull run as having started at the last low of March 2009, when the S&P 500 plunged to the 700 area, then yes, 153% over four years is unsustainable. But as shown in the graph below (click to enlarge), the growth didn’t really start there.
 Source: BigCharts.com
The latest trading range for equities beginning in the late 1990s has been – on the S&P 500 index – confined between about 1,500-1,550 at the top to about 700-800 at the bottom, with a median level of about 1,100 (blue line).
Throughout the past 15 years, that 1,100 median level has been reverted to repeatedly (yellow circles) and could thus be considered the markets’ true level throughout that period. Any rise above that mark was twice erased, while any dip below it was twice reclaimed.
Since corrections overshoot well below the markets’ true valuation in quick, irrational panic attacks (red circle), the current rally’s early move from 700 in March 2009 back up to the 1,100 median in just nine months was merely a reclaiming of what rightfully belonged to the market in the first place. Even as Morganlander indicated to Bloomberg, we can’t really count that early period since it was “a highly unusual time with markets in complete disarray.”
Our current rally, therefore, really began at the median 1,100 level and measures a more tepid 60% gain above the 15-year median mark. Equities really aren’t as overheated as people imagine, and “after the rally this year, we’re fairly valued at best,” Morganlander affirmed.
That means the markets can go higher, and they likely will, given the Federal Reserve’s helping hand. But that raises another concern – what will happen when the Federal Reserve withdraws its assistance?
Markets Aren’t Really That Safe
It really should not surprise anyone that the Federal Reserve’s actions have greatly influenced equity markets, especially in its raising and lowering of the benchmark interest rate as noted in the graph below (click to enlarge), where the blue line indicates the rate’s adjustment (drawn at a different scale).
 Source: BigCharts.com
It’s clear and simple: when rates are low, markets rise. Low rates mean easy access to cheap financing, saving companies money on interest, which improves their profits. The only problem here is that rates are being kept too low for too long.
We can understand the Federal Reserve’s thinking, though. The last time rates were raised from 2004 to 2006, they were raised perhaps a little too quickly, which may have contributed in some measure to the 2008 plunge. Federal Reserve Chairman Bernanke has repeatedly stated he does not want to create that same risk by raising the benchmark rate too fast.
But no matter how long the Fed takes, the raising of interest rates will cause the markets to tumble to some degree. Some are expecting a correction even sooner than that, with the reduction of the Fed’s monthly bond buying program, or QE3.
The Best Free Investment You’ll Ever Make
Join Wealth Daily today for FREE. We”ll keep you on top of all the hottest investment ideas before they hit Wall Street. Become a member today, and get our latest free report: “A Maverick’s Guide to Gold: 3 Gold Stocks Set to Disrupt the Market”
It contains full details on something incredibly important that’s unfolding and affecting how gold is classified as an investment..
After getting your report, you’ll begin receiving the Wealth Daily e-Letter, delivered to your inbox daily.
The Key to the Markets’ Future
Yet while the last graph clearly shows the impact of the benchmark interest rate on the equities markets, it does not show any significant impact caused by the Fed’s monthly bond purchases. Implemented in late 2012, the program made no noticeable change to the markets’ trajectory, which was already climbing steadily on the back of low interest rates.
The real purpose of the Treasury and mortgage-backed security buying program wasn’t really to lift the equity markets up in the first place; rather, it was to push mortgage interest rates down. Since its implementation didn’t really push markets up all that much, it would be reasonable to conclude that its withdrawal will not pull markets down all that much either.
Certainly, there will be something of a pullback on the announcement of the beginning of the program’s tapering. But that pullback will be short lived, since the Fed has indicated it will not touch the benchmark interest rate just yet. That is the real drug flowing through the equity markets’ veins: low interest, not bond purchases.
This gives us a better idea of how long this equity run should last – it will last as long as rates remain low. And how long is that?
The Federal Reserve has indicated that “this exceptionally low range for the federal funds rate will be appropriate at least as long as the unemployment rate remains above 6-1/2 percent, inflation between one and two years ahead is projected to be no more than a half percentage point above the Committee’s 2 percent longer-run goal, and longer-term inflation expectations continue to be well anchored.”
And where are we now? The unemployment rate is at 7.3% and inflation is between 1.1 and 1.5%, depending on which inflation gauge you consult. These numbers are far short of the 6.5% and 2.5% “thresholds” the Fed is looking for. Remember the difference between “thresholds” and “targets”? By calling them thresholds, the Fed is telling us that it can still keep the interest rate unchanged even after those numbers are reached; they are not automatic triggers.
What to Expect
At $85 billion a month, the monthly bond buying program has already added $1.1 trillion worth of purchases to the Fed’s balance sheet. The Fed has to finish it soon. Given the uncertainty over the ongoing debt ceiling discussions, the phasing out of QE3 will likely begin early in 2014 and be completed by the end of that year.
When tapering is first announced, we should expect a slight pullback in equities, possibly from 5 to 10%. But all the while, the benchmark interest rate will remain untouched at 0.25%. We can thus expect the equity markets to shake tapering off and continue their rally throughout 2014.
The real danger for the markets is the raising of the benchmark interest rate. At some point, lower unemployment and higher inflation will give the Fed the green light to begin the long journey back to rate normalization, likely beginning in late 2015 or early 2016. That is when we can expect the markets to slow down and perhaps even tumble.
During the past two cycles, from trough to peak, the equity markets ran for 6 years and 5 years respectively. So far it has been only 4 years since the last bottom (the first part of which can’t really be counted due to the overdone correction of 2008). Add to that the inconsequential effect on equities by the Fed’s monthly purchasing program, plus the Fed’s commitment to low interest rates, and we can reasonably consider the current equity run as having at least one to two years of life remaining.
Since we have decidedly broken through the previous 1,500 barrier, the markets have probably outgrown the old 1,100 median level, with 1,500 now becoming the new median marker the markets will straddle going forward. But we must keep in mind that corrections always overshoot to the downside, sometimes cutting markets by as much as 50%. That 1,100 level may no longer be the median, but it can still be touched as the low of the next major correction when interest rates start to rise in about two years’ time.
Joseph Cafariello
If you liked this article, you may also enjoy: